砂防・地すべり技術センター")
◆Debris flow simulator ”Kanako”
Here, You can download GUI equipped debris flow simulator “Kanako”.
Japanese version :
・土石流シミュレータ「Kanako」
◇About “Kanako”
Sabo dam (sediment check dam) is built in order to mitigate sediment-related disasters such as debris flow, sediment washout, and debris avalanches. Principally the impact of sabo facility is expressed as its erosion control function. Effectiveness of sabo dam needs to be properly estimated in the process of sabo planning and facility design. Location, types, and dimensions of sabo facility is so adjusted as to achieve its designated engineering objectives, either blocking main body of debris flow or streamlining sediment flood in mountainous ravines. Numerical simulation is an effective vehicle to convince both designers and related persons of the project of the validity of the planned facility. The results of numerical simulation has not been well presented so far, which significantly reduces the expected impact of its introduction. Such depressing experience has pushes practitioners into relying heavily on proprietary technical consultants.
Thus, the introduction of this simulator “Kanako,” user friendly enough to overcome current gridlocks. User interface is much polished to become more communicative in terms of interface. Any users are able to set up and fine tune calculation conditions graphically at their will just by simple click and pulled-down menu options. Results of simulation are put out in an intuitive manner. Specific mastery of coding or technical expertise is not required to run the simulation task for “Kanako.” Please have a try and enjoy professional-level simulation experience with and improved interface.
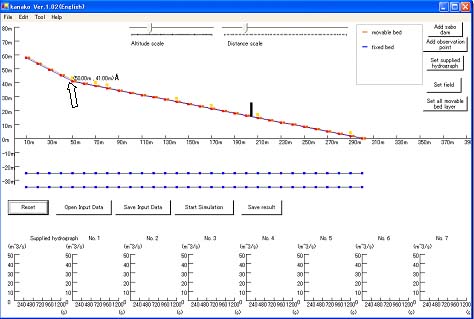
Riberbed profile can be changed.
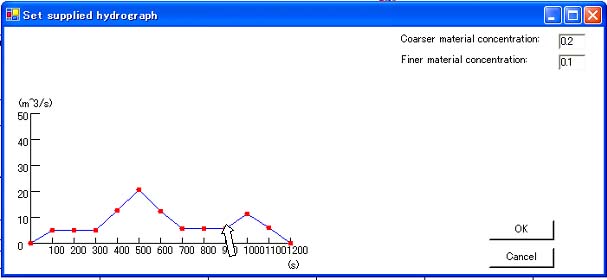
he discharge of debris flow can be changed by dragging.
Trainsition of water depth and riverbed can be checked from screen easily.
◇Limit and assumptions of using Kanako
As written below, there are some limit and assumptions on analysis using Kanako.Please notice that there are some limit and assumptions when using Kanako.
| 1. | The target is stony debris flow. And bed load is off the subject. |
| 2. | In the simulation, only one Mountain River is the subject. We don’t consider the confluence of Mountain Rivers. |
| 3. | We consider only 2 kinds of material size of the debris flow at 1-D model,and 1 kinds of material size of the debris flow at 2-D model. |
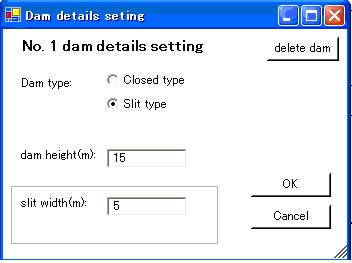
| 4. | Considering slit type sabo dam, the model does not currently incorporate energy loss from the rapid narrowing of river width at 1-D area. |
| 5. | In the calculation, a rectangular cross section is assumed. |
| 6. | We don’t consider sediment sorting in the stony debris flow. |
| 7. | We don’t consider the temporal and spatial change of grain size distribution in river bed.We don’t consider the temporally and spatially change of grain size distribution in river bed. |
◇Operating instructions
1.License
Copyright for this software belongs to Sedimentation Disasters, Research Center for Fluvial and Coastal Disasters, Disaster Prevention Research Institute, Kyoto University, & SABO AND LANDSLIDE TECHNICAL CENTER.
2.Restrictions
The user may not take any of following actions, without permission of the License owner (here in after called “Owner”) :
(1) Copy, modify or otherwise duplicate the whole or a part of the Software
(2) Decompile or modify using reverse engineering, disassemble, or otherwise reprogram the Software;
(3) Distribute, sell, sublease or lease the Software to third parties;
3.Disclaimer
(1) The owner makes no warranty or representations that the Software will run uninterrupted or is error free.
(2) The owner shall not guarantee that the functions and performance of the Software will meet the requirements of the customer.
(3) The owner shall not be responsible for losses sustained by the customer or the recovery of damages incurred by a third party,
or any other cost incurred in using the Software.
4.Change of Specifications
The specifications or design of the software and the contents of the instruction manual may be changed without notice by the owner.
◇Download
“Kanako” is freeware.You may click here to get “Kanako” .
| program | manual | ||
| 1-D | Kanako1.44 (47 KB) |
manual (0.5MB) |
detailed manual (4.0MB) |
| 2-D | Kanako2D.2.051 (75KB) |
manual (1.5MB) |
– |
■Installation and Startup
1.Operating Environment
The operating environment for software installation is as follows:
– CPU: Intel Pentium or equivalent
– Memory: 128 MB or more
– Operating System: Microsoft Windows7/8/10
– Hard Disk: Needs free space of at least 600 MB
– Necessary software: Microsoft .NET Framework 3.5(includes .NET 2.0 and 3.0)
Note: In some languages setting situation, software doesn’t move property. In that case, please change the PC language setting as “English”.
◇Limitation of input data number and output data number
1.Kanako1.44
Maximum of calculation points is 500. Though, due to the monitor screen size, downstream from No.100 points sometimes can’t be seen on the screen. But even in those cases,calculation is done properly and you can see and check the result from the output data.
Due to limitations of array elements, the upper limit of the number of the output hydrograph data is 1000. The number can be calculated from dividing” Simulation continuance time” by “Time interval of output hydrograph data” plus 1, because 0s is also output.
Due to limitations of array elements, the upper limit of the number of the output data, all points’ flow depth, riverbed variation, velocity and concentration, is 1000. The number can be calculated from dividing” Simulation continuance time” by “Time interval of output result data” plus 1, because 0s is also output.
For the variable type specification in Kanako, “Time interval of output hydrograph data (s)” and “Time interval of output result data (s)” should be set as integer value.
2.Kanako2D.Ver.2.051
For 1-D area, maximum of calculation points is 500. Though, due to the monitor screen size, downstream to No.100 point sometimes can’t be seen on the screen.
But even in those cases, calculation is done properly and you can see and check the result from the output data.
For 2-D area, recommended maximum of calculation points is 300 x 300 (flow direction x cross direction). Though setting within 300 x 300, error may occur due to the PC spec. The initial setting is 60 x 60. The number of the flow axis and cross direction can be different (e.g. such as 60 x 100) but the grid is limited to the square lattice.
Due to limitations of array elements, the number of simulation result outputs “nijidat” has Max value. “nijidat” is set by the number of flow direction points, and the number of cross direction points, and the number calculated from dividing” Simulation continuance time” by “Time interval of output result data”.
We checked in 3 PC that program work on the simulation cases as following [flow direction x cross direction, (Simulation continuance time(s) / Time interval of output result data(s) )] ; [200×200, 3600s/10s] & [300×300, 3000s/20s] & [300×300, 1800s/10s]
Windows10 Professional(64bit), Intel® Core™ i7-9700 processor (3.00GHz), 64GB RAM
Windows10 Professional(64bit), Intel® Core™ i7-10750 processor (2.59GHz), 32GB RAM
Windows10 Professional(64bit), Intel® Core™ i7-10810 processor (1.1GHz),16GB RAM
Due to limitations of array elements, the upper limit of the number of the output hydrograph data in 1D area is 1000. The number can be calculated from dividing” Simulation continuance time” by “Time interval of output hydrograph data” plus 1, because 0s is also output.
For the variable type specification in Kanako2D, “Time interval of output hydrograph data (s)” and “Time interval of output result data (s)” should be set as integer value.
◇Contact adress
E-mail:kanako@stc.or.jp
◇Copyright holder
NAKATANI Hasegawa Kana
Professor, Sedimentation Disasters, Research Center for Fluvial and Coastal Disasters, Disaster Prevention Research Institute, Kyoto University
Sabo Technology Research Institute, SABO AND LANDSLIDE TECHNICAL CENTER, Japan
Mailing Address:2-7-5, Hirakawacho, Chiyoda-ku, Tokyo 102-0093, Japan
Phone: 81-3-5276-3274